Market Outlook
November 17, 2016
Market Cues
Domestic Indices
Chg (%)
(Pts)
(Close)
BSE Sensex
(0.0)
(6)
26,299
Indian markets are likely to open positive tracking SGX Nifty.
Nifty
0.0
3
8,112
U.S. Markets closed mixed on Wednesday, with a post-U.S. election rally slowing
Mid Cap
0.6
67
12,044
down as financials dropped more than 1 percent.
Small Cap
0.1
6
11,908
The European markets ended Wednesday's session in negative territory. Following 2
Bankex
(1.0)
(213)
21,841
days of gains, investors took the opportunity to cash in some profits. Traders also
turned more cautious ahead of Federal Reserve Chair Janet Yellen's testimony
Global Indices
Chg (%)
(Pts)
(Close)
before the U.S. Congress, which will begin on Thursday.
Dow Jones
(0.3)
(55)
18,868
Indian markets erased early gains to end on a flat note on Wednesday, as rate cut
Nasdaq
0.4
19
5,295
hopes were tempered by weak cues from Europe and a heated political debate in
FTSE
(0.6)
(43)
6,750
Parliament over scrapping of 500 and 1,000 rupee notes.
Nikkei
1.1
194
17,862
News Analysis
Hang Seng
(0.2)
(43)
22,281
Result Review: Engineers India second quarter net profit jumps 21% to `94cr
Shanghai Com
(0.1)
(2)
3,205
Detailed analysis on Pg2
Advances / Declines
BSE
NSE
Investor’s Ready Reckoner
Advances
1,056
682
Key Domestic & Global Indicators
Declines
1,554
942
Stock Watch: Latest investment recommendations on 150+ stocks
Unchanged
161
56
Refer Pg5 onwards
Top Picks
Volumes (` Cr)
CMP
Target
Upside
Company
Sector
Rating
(`)
(`)
(%)
BSE
4,303
Amara Raja BatteriesAuto & Auto Ancill.
Buy
932
1,167
25.3
NSE
26,142
HCL Tech
IT
Buy
776
1,000
28.8
Asian Granito
Capital Goods
Buy
209
351
68.1
Net Inflows (` Cr)
Net
Mtd
Ytd
Equitas Holdings
Financials
Buy
158
235
49.1
Navkar Corporation Others
Buy
182
265
45.5
FII
(1,432)
(3,740)
41,275
More Top Picks on Pg3
MFs
(67)
4,101
26,154
Key Upcoming Events
Previous
Consensus
Top Gainers
Price (`)
Chg (%)
Date
Region
Event Description
Reading
Expectations
Bajfinance
897
10.2
Nov 17 US
Producer Price Index (mom)
0.80
Cholafin
977
8.6
Nov 17 US
Housing Starts
1,047.00
1,160.00
Bharatfin
685
8.2
Nov 17 Euro Zone Euro-Zone CPI (YoY)
0.50
0.50
Nov 17 US
Building permits
1,225.00
1,195.00
Mfsl
533
7.8
Nov 17 US
Consumer price index (mom)
0.30
0.40
Oberoirlty
288
7.4
Nov 22 Euro Zone Euro-Zone Consumer Confidence
(8.00)
Nov 22 US
Existing home sales
5.47
5.45
3.696.(
Top Losers
Price (`)
Chg (%)
More Events on Pg4
Pcjeweller
327
(7.8)
Srf
1,523
(6.0)
Gppl
139
(5.4)
Balramchin
113
(5.3)
Dlf
109
(5.1)
As on November 16, 2016
Market Outlook
November 17, 2016
Result Review
Engineers India second quarter net profit jumps 21% to `94cr
State-owned Engineers India (EIL) reported a 21% jump in September quarter net
profit and declared a 1:1 bonus share. Net profit in July-September rose to
`93.8cr as compared to `77.2cr in the same period a year before.
Turnover, however, decreased to `394.9cr for the quarter ended September 30,
from `510.3cr in Q2 of last fiscal.
EIL said its board at its meeting today recommended the issue of bonus shares in
the proportion of one new equity share of `5 each for every one existing equity
shares of `5 each fully paid up of the company. EIL had last issued a 2:1 bonus
share in March 2010. A similar ratio bonus share was issued in December 1999
and August 1999.
Economic and Political News
Post demonetization, India losing ` 25,000cr in GDP everyday: West Bengal
FM
Moody's affirms India's ratings with a positive outlook
Gross NPAs in steel sector at `1.15 lakh cr: Govt
Bond yield eases further on rate cut hopes; may fall to 6% in 1 year
Corporate News
SBI collects `1,14,139cr deposits in 7 days
Power Grid Corporation of India awards Sterling and Wilson a `250cr project
Sun Pharma’s Taro recalls 17,100 dandruff care kits in US
Market Outlook
November 17, 2016
Top Picks ★★★★★
Large Cap
Market Cap
CMP
Target
Upside
Company
Rationale
(` Cr)
(`)
(`)
(%)
To outpace battery industry growth due to better technological
Amara Raja Batteries
15,914
932
1,167
25.3
products leading to market share gains in both the
automotive OEM and replacement segments.
The stock is trading at attractive valuations and is factoring all
HCL Tech
1,09,517
776
1,000
28.8
the bad news.
Back on the growth trend, expect a long term growth of 14%
Infosys
2,15,936
940
1,249
32.8
to be a US$20bn in FY2020.
Source: Company, Angel Research
Mid Cap
Market Cap
CMP
Target
Upside
Company
Rationale
(` Cr)
(`)
(`)
(%)
We expect the company would report strong profitability
Asian Granito
628
209
351
68.1
owing to better product mix, higher B2C sales and
amalgamation synergy.
Among the top 4 players in the consumer durables segment.
Bajaj Electricals
2,227
220
306
38.9
Improved profitability backed by turn around in E&P segment.
Strong order book lends earnings visibility.
Favourable outlook for the AC industry to augur well for
Cooling products business which is out pacing the market
Blue Star
4,387
460
634
37.8
growth. EMPPAC division's profitability to improve once
operating environment turns around.
With a focus on the low and medium income (LMI) consumer
Dewan Housing Finance
7,225
231
350
51.6
segment, the company has increased its presence in tier-II &
III cities where the growth opportunity is immense.
Strong loan growth backed by diversified loan portfolio and
Equitas Holdings
5,286
158
235
49.1
adequate CAR. ROE & ROA likely to remain decent as risk of
dilution remains low. Attractive valuations considering growth.
Economic recovery to have favourable impact on advertising
& circulation revenue growth. Further, the acquisition of a
Jagran Prakashan
5,714
175
225
28.7
radio business (Radio City) would also boost the company's
revenue growth.
Speedier execution and speedier sales, strong revenue visibilty
Mahindra Lifespace
1,530
373
522
40.0
in short-to-long run, attractive valuations
We expect the company to report strong growth on back of
healthy growth in domestic branded sales (owing to
Mirza International
937
78
113
45.2
aggressive ad spend and addition in the number of EBOs &
multi-brand outlets [MBOs]) and healthy export revenues.
Massive capacity expansion along with rail advantage at ICD
Navkar Corporation
2,597
182
265
45.5
as well CFS augurs well for the company.
Strong brands and distribution network would boost growth
Siyaram Silk Mills
1,153
1,230
1,714
39.4
going ahead. Stock currently trades at an inexpensive
valuation.
Market leadership in Hindi news genre and no. 2 viewership
ranking in English news genre, exit from the radio business,
TV Today Network
1,860
312
385
23.5
and anticipated growth in ad spends by corporates to benefit
the stock.
Source: Company, Angel Research
Market Outlook
November 17, 2016
Key Upcoming Events
Result Calendar
Date
Company
November 17, 2016 Petronet LNG
November 18, 2016 NHPC
November 19, 2016 India Cements, Siyaram Silk Mills
November 21, 2016 Nalco
Source: Bloomberg, Angel Research
Global economic events release calendar
Bloomberg Data
Date
Time
Country
Event Description
Unit
Period
Last Reported
Estimated
Nov 17, 2016
US
Producer Price Index (mom)
% Change Oct
0.80
7:00 PM
US
Housing Starts
Thousands Oct
1,047.00
1,160.00
3:30 PM Euro Zone
Euro-Zone CPI (YoY)
%
Oct F
0.50
0.50
7:00 PM
US
Building permits
Thousands Oct
1,225.00
1,195.00
7:00 PM
US Consumer price index (mom)
% Change Oct
0.30
0.40
Nov 22, 2016
8:30 PM Euro ZoneEuro-Zone Consumer Confidence
Value
Nov A
(8.00)
8:30 PM
US
Existing home sales
Million
Oct
5.47
5.45
Nov 23, 2016
2:00 PM Germany
PMI Services
Value
Nov P
54.20
2:00 PM Germany
PMI Manufacturing
Value
Nov P
55.00
8:30 PM
US
New home sales
Thousands Oct
593.00
585.00
Nov 24, 2016
12:30 PM Germany
GDP nsa (YoY)
% Change 3Q F
1.50
Nov 25, 2016
3:00 PM
UK
GDP (YoY)
% Change 3Q P
2.30
Nov 29, 2016
7:00 PM
US
GDP Qoq (Annualised)
% Change 3Q S
2.90
8:30 PM
US
Consumer Confidence S.A./ 1985=100 Nov
98.60
Nov 30, 2016
3:00 PM
UK
PMI Manufacturing
Value Nov
54.30
Dec 01, 2016
2:25 PM Germany Unemployment change (000's)
Thousands Nov
(13.00)
6:30 AM
China
PMI Manufacturing
Value Nov
51.20
Dec 02, 2016
7:00 PM
US
Change in Nonfarm payrolls
Thousands Nov
161.00
7:00 PM
US
Unnemployment rate
% Nov
4.90
Dec 06, 2016
3:30 PM Euro Zone
Euro-Zone GDP s.a. (QoQ)
% Change 3Q F
0.30
Source: Bloomberg, Angel Research
Market Outlook
November 17, 2016
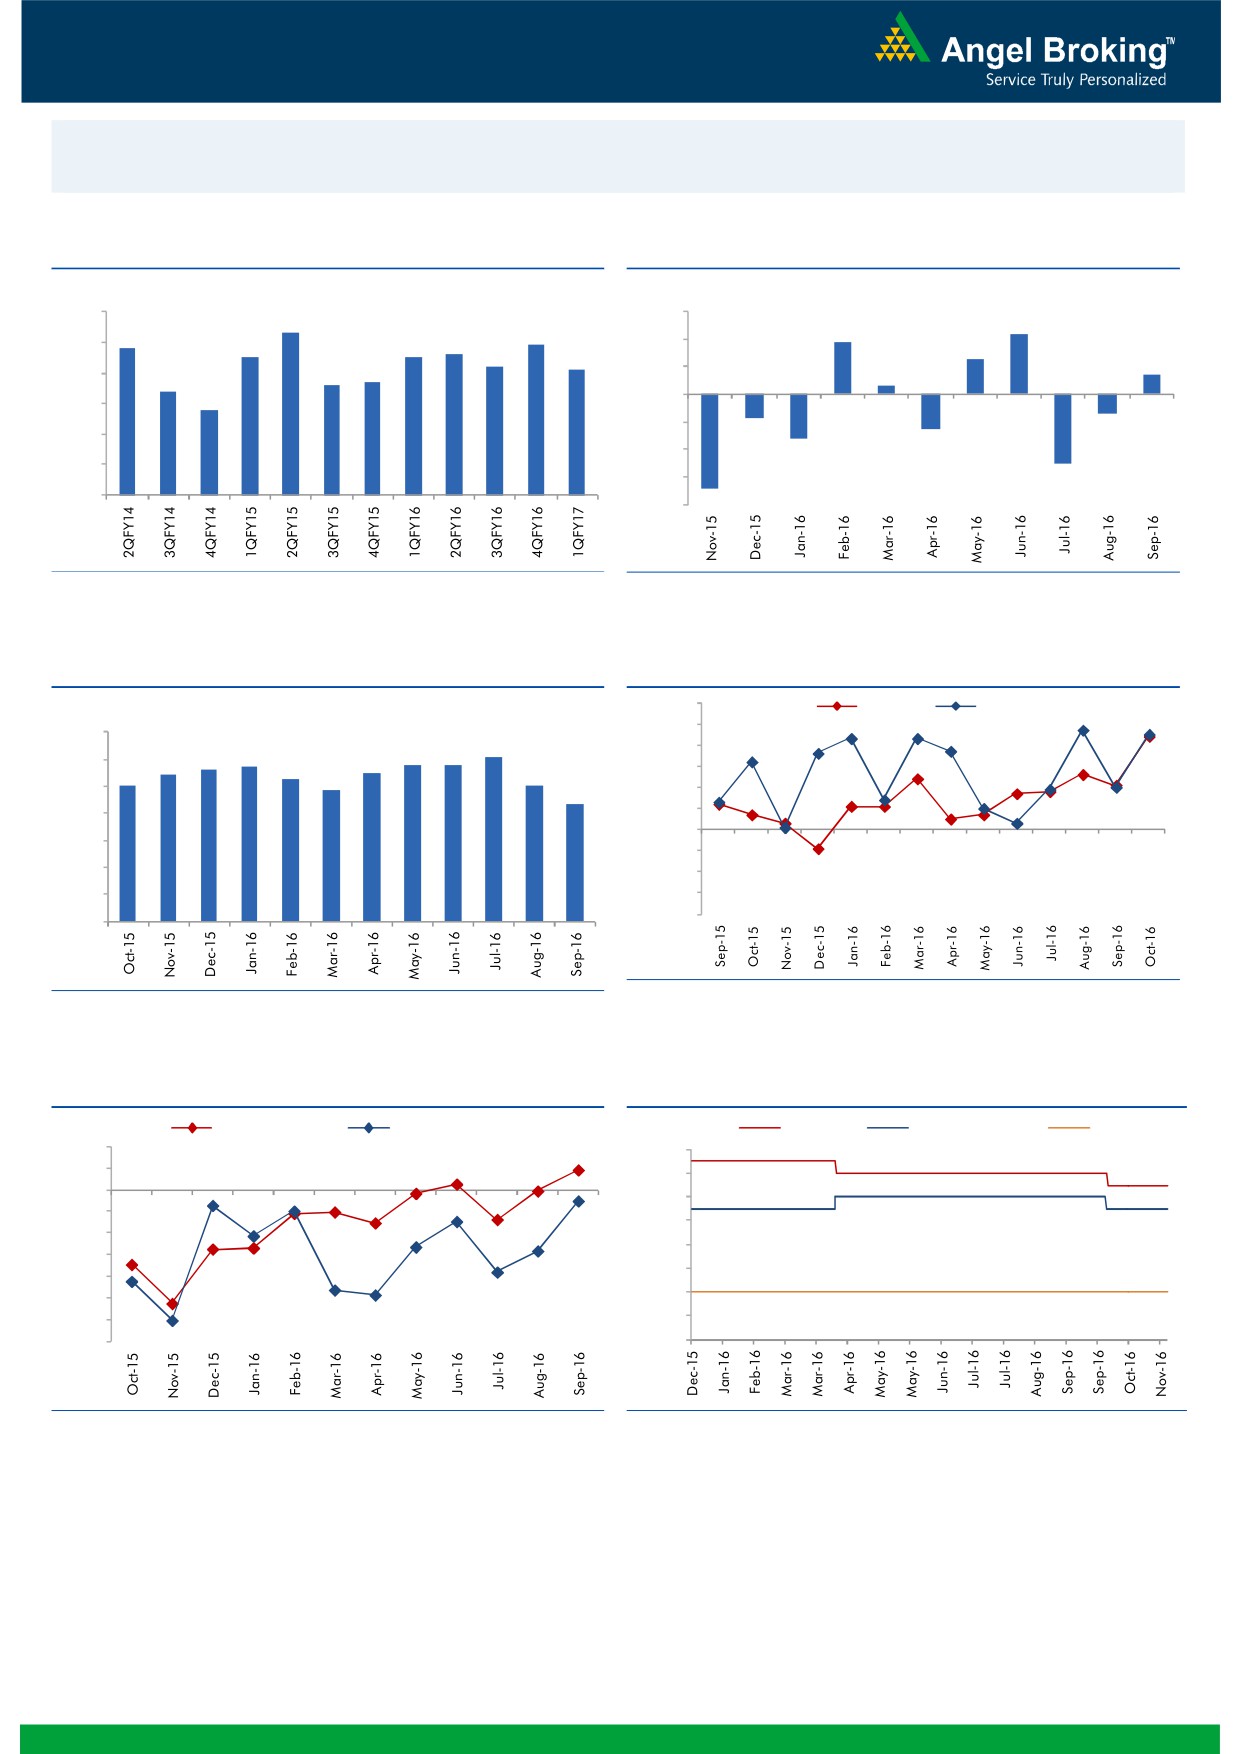
Macro watch
Exhibit 1: Quarterly GDP trends
Exhibit 2: IIP trends
(%)
(%)
9.0
8.3
3.0
2.2
7.8
7.9
1.9
8.0
7.5
7.5
7.6
2.0
1.3
7.2
7.1
0.7
6.6
6.7
1.0
0.3
7.0
6.4
5.8
-
6.0
(1.0)
5.0
(0.9)
(0.7)
(2.0)
(1.3)
(1.6)
4.0
(3.0)
(2.5)
3.0
(4.0)
(3.4)
Source: CSO, Angel Research
Source: MOSPI, Angel Research
Exhibit 3: Monthly CPI inflation trends
Exhibit 4: Manufacturing and services PMI
56.0
Mfg. PMI
Services PMI
(%)
55.0
7.0
6.1
5.7
5.8
5.8
54.0
5.6
5.5
6.0
5.4
5.3
5.0
5.1
53.0
4.8
5.0
4.3
52.0
4.0
51.0
50.0
3.0
49.0
2.0
48.0
1.0
47.0
46.0
-
Source: Market, Angel Research; Note: Level above 50 indicates expansion
Source: MOSPI, Angel Research
Exhibit 5: Exports and imports growth trends
Exhibit 6: Key policy rates
(%)
Exports yoy growth
Imports yoy growth
(%)
Repo rate
Reverse Repo rate
CRR
10.0
7.00
5.0
6.50
0.0
6.00
(5.0)
5.50
(10.0)
5.00
(15.0)
4.50
(20.0)
4.00
(25.0)
(30.0)
3.50
(35.0)
3.00
Source: Bloomberg, Angel Research
Source: RBI, Angel Research
Market Outlook
November 17, 2016
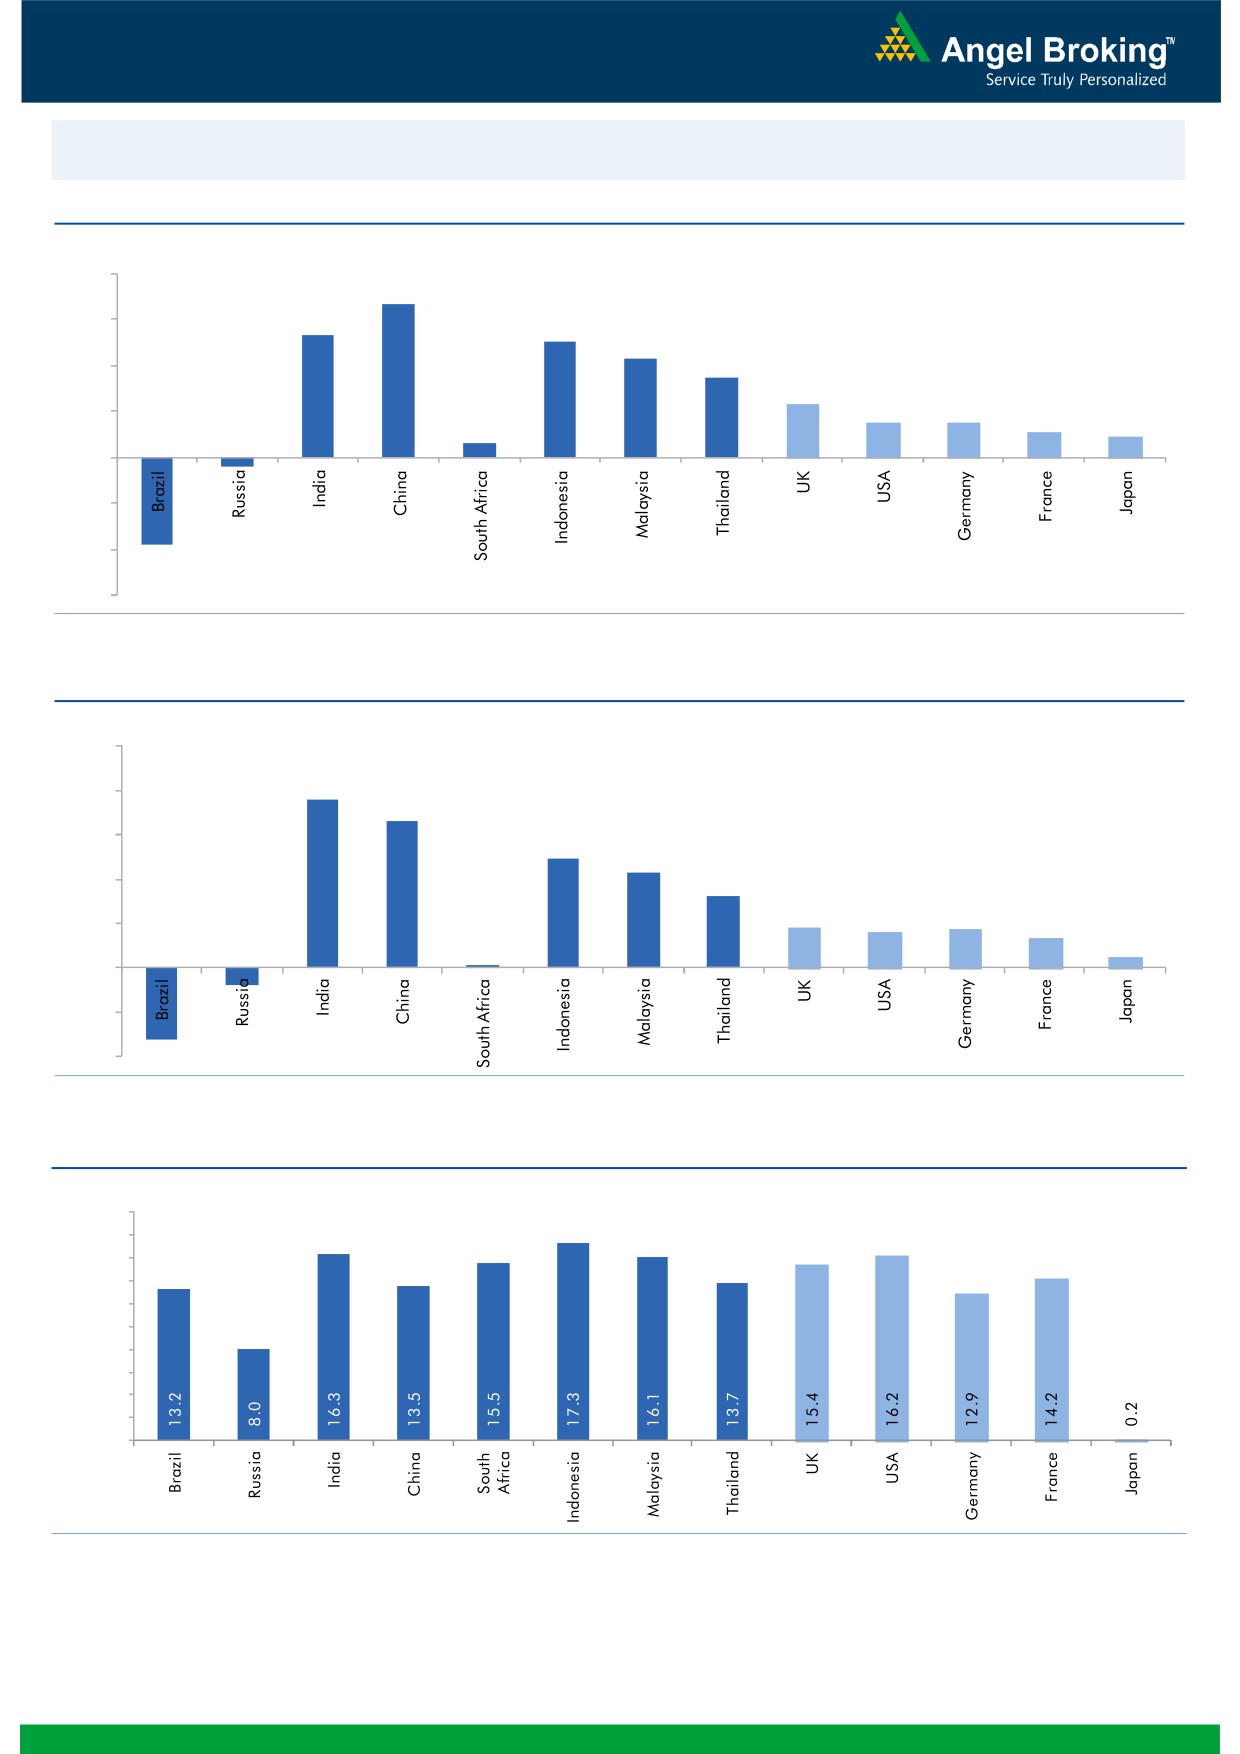
Global watch
Exhibit 1: Latest quarterly GDP Growth (%, yoy) across select developing and developed countries
(%)
8.0
6.7
6.0
5.3
0.6
5.0
4.3
3.5
4.0
2.3
1.5
1.5
2.0
1.1
0.9
-
(2.0)
(0.4)
(4.0)
(3.8)
(6.0)
Source: Bloomberg, Angel Research
Exhibit 2: 2016 GDP Growth projection by IMF (%, yoy) across select developing and developed countries
(%)
10.0
7.6
8.0
6.6
6.0
4.9
4.3
4.0
3.2
1.8
1.7
1.6
2.0
1.3
(0.8)
0.5
(3.3)
0.1
-
(2.0)
(4.0)
Source: IMF, Angel Research
Exhibit 3: One year forward P-E ratio across select developing and developed countries
(x)
20.0
18.0
16.0
14.0
12.0
10.0
8.0
6.0
4.0
2.0
-
Source: IMF, Angel Research
Market Outlook
November 17, 2016
Exhibit 4: Relative performance of indices across globe
Returns (%)
Country
Name of index
Closing price
1M
3M
1YR
Brazil
Bovespa
60,759
(0.6)
4.2
31.5
Russia
Micex
2,029
3.2
3.0
16.6
India
Nifty
8,112
(5.5)
(5.4)
2.0
China
Shanghai Composite
3,205
3.6
5.9
(12.4)
South Africa
Top 40
43,592
(1.5)
(5.4)
(5.9)
Mexico
Mexbol
44,902
(5.9)
(7.1)
0.6
Indonesia
LQ45
870
(7.3)
(7.8)
13.1
Malaysia
KLCI
1,628
(1.6)
(3.4)
(3.5)
Thailand
SET 50
917
(2.8)
(6.1)
0.4
USA
Dow Jones
18,868
4.3
1.6
6.4
UK
FTSE
6,750
(2.8)
(1.6)
6.6
Japan
Nikkei
17,862
6.0
5.6
(7.3)
Germany
DAX
10,664
1.5
1.2
(3.8)
France
CAC
4,501
1.1
1.4
(8.0)
Source: Bloomberg, Angel Research
Stock Watch
November 17, 2016
Company Name
Reco
CMP
Target
Mkt Cap
Sales ( Čcr )
OPM(%)
EPS (Č)
PER(x)
P/BV(x)
RoE(%)
EV/Sales(x)
(Č)
Price ( Č)
( Č cr )
FY17E FY18E
FY17E
FY18E
FY17E
FY18E
FY17E
FY18E
FY17E
FY18E
FY17E
FY18E
FY17E
FY18E
Agri / Agri Chemical
Rallis
Accumulate
189
209
3,681
1,937
2,164
13.3
14.3
9.0
11.0
21.0
17.2
3.7
3.2
18.4
19.8
2.0
1.7
United Phosphorus
Accumulate
620
684
31,442
15,176
17,604
18.5
18.5
37.4
44.6
16.6
13.9
3.3
2.7
21.4
21.2
2.1
1.8
Auto & Auto Ancillary
Ashok Leyland
Buy
79
111
22,539
22,407
26,022
10.6
10.6
5.2
6.4
15.2
12.3
3.4
2.9
23.6
24.7
1.1
1.0
Bajaj Auto
Neutral
2,611
-
75,549
25,093
27,891
19.5
19.2
143.9
162.5
18.1
16.1
5.1
4.4
30.3
29.4
2.7
2.4
Bharat Forge
Neutral
904
-
21,036
7,726
8,713
20.5
21.2
35.3
42.7
25.6
21.2
4.7
4.3
18.9
20.1
2.8
2.4
Eicher Motors
Neutral
21,117
-
57,355
16,583
20,447
17.5
18.0
598.0
745.2
35.3
28.3
12.1
9.2
41.2
38.3
3.1
2.5
Gabriel India
Buy
105
130
1,507
1,544
1,715
9.0
9.3
5.4
6.3
19.4
16.7
3.7
3.3
18.9
19.5
1.0
0.8
Hero Motocorp
Buy
2,915
3,541
58,199
30,958
34,139
15.7
15.7
193.6
208.3
15.1
14.0
5.9
4.9
34.2
30.5
1.7
1.5
Jamna Auto Industries Neutral
183
-
1,463
1,486
1,620
9.8
9.9
15.0
17.2
12.2
10.7
2.7
2.3
21.8
21.3
1.0
0.9
L G Balakrishnan & Bros Neutral
585
-
918
1,302
1,432
11.6
11.9
43.7
53.0
13.4
11.0
1.9
1.7
13.8
14.2
0.8
0.7
Mahindra and Mahindra Neutral
1,230
-
76,370
46,534
53,077
11.6
11.7
67.3
78.1
18.3
15.8
3.0
2.6
15.4
15.8
1.6
1.4
Maruti
Buy
4,983
6,006
150,539
68,057
82,958
15.8
15.5
212.1
261.2
23.5
19.1
4.7
3.9
19.8
20.3
1.8
1.4
Minda Industries
Neutral
306
-
2,424
2,728
3,042
9.0
9.1
68.2
86.2
4.5
3.5
1.0
0.8
23.8
24.3
1.0
0.8
Motherson Sumi
Neutral
294
-
41,295
45,896
53,687
7.8
8.3
13.0
16.1
22.6
18.3
7.3
5.8
34.7
35.4
0.9
0.8
Rane Brake Lining
Neutral
862
-
683
511
562
11.3
11.5
28.1
30.9
30.7
27.9
4.7
4.3
15.3
15.0
1.5
1.4
Setco Automotive
Neutral
38
-
511
741
837
13.0
13.0
15.2
17.0
2.5
2.3
0.4
0.4
15.8
16.3
1.1
1.0
Tata Motors
Neutral
458
-
132,205
300,209
338,549
8.9
8.4
42.7
54.3
10.7
8.4
1.7
1.5
15.6
17.2
0.6
0.5
TVS Motor
Neutral
359
-
17,065
13,390
15,948
6.9
7.1
12.8
16.5
28.2
21.7
7.0
5.5
26.3
27.2
1.3
1.0
Amara Raja Batteries
Buy
932
1,167
15,914
5,504
6,605
18.4
19.8
33.4
40.9
27.9
22.8
6.2
5.0
22.1
22.0
2.7
2.3
Exide Industries
Neutral
178
-
15,160
7,439
8,307
15.0
15.0
8.1
9.3
22.0
19.2
3.1
2.8
14.3
16.7
1.6
1.4
Apollo Tyres
Buy
184
235
9,379
12,877
14,504
14.3
13.9
21.4
23.0
8.6
8.0
1.3
1.2
16.4
15.2
0.9
0.8
Ceat
Buy
1,243
1,450
5,027
7,524
8,624
13.0
12.7
131.1
144.3
9.5
8.6
1.7
1.5
19.8
18.6
0.7
0.6
JK Tyres
Neutral
122
-
2,756
7,455
8,056
15.0
15.0
21.8
24.5
5.6
5.0
1.2
1.0
22.8
21.3
0.5
0.4
Swaraj Engines
Neutral
1,327
-
1,649
660
810
15.2
16.4
54.5
72.8
24.4
18.2
7.6
6.9
31.5
39.2
2.3
1.8
Subros
Neutral
147
-
879
1,488
1,681
11.7
11.9
6.4
7.2
22.9
20.5
2.4
2.2
10.8
11.4
0.8
0.7
Indag Rubber
Neutral
167
-
438
286
326
19.8
16.8
11.7
13.3
14.3
12.5
2.4
2.3
17.8
17.1
1.2
1.0
Capital Goods
ACE
Neutral
44
-
433
709
814
4.1
4.6
1.4
2.1
31.3
20.9
1.3
1.2
4.4
6.0
0.8
0.7
BEML
Neutral
861
-
3,586
3,451
4,055
6.3
9.2
31.4
57.9
27.4
14.9
1.7
1.5
6.3
10.9
1.2
1.0
Bharat Electronics
Accumulate
1,306
1,414
29,179
8,137
9,169
16.8
17.2
58.7
62.5
22.3
20.9
3.5
3.1
44.6
46.3
2.8
2.5
Stock Watch
November 17, 2016
Company Name
Reco
CMP
Target
Mkt Cap
Sales ( Čcr )
OPM(%)
EPS (Č)
PER(x)
P/BV(x)
RoE(%)
EV/Sales(x)
(Č)
Price ( Č)
( Č cr )
FY17E
FY18E
FY17E
FY18E
FY17E
FY18E
FY17E
FY18E
FY17E
FY18E
FY17E
FY18E
FY17E
FY18E
Capital Goods
Voltas
Buy
328
407
10,861
6,511
7,514
7.9
8.7
12.9
16.3
25.5
20.1
4.6
4.0
16.7
18.5
1.4
1.2
BGR Energy
Neutral
106
-
765
16,567
33,848
6.0
5.6
7.8
5.9
13.6
18.0
0.8
0.8
4.7
4.2
0.1
0.1
BHEL
Neutral
132
-
32,235
28,797
34,742
-
2.8
2.3
6.9
57.3
19.1
1.0
0.9
1.3
4.8
0.8
0.5
Blue Star
Buy
460
634
4,387
4,283
5,077
5.9
7.3
14.9
22.1
30.9
20.8
6.0
5.1
20.4
26.4
1.1
0.9
Crompton Greaves
Neutral
74
-
4,635
5,777
6,120
5.9
7.0
3.3
4.5
22.4
16.4
1.0
0.9
4.4
5.9
0.8
0.7
Greaves Cotton
Neutral
126
-
3,065
1,755
1,881
16.8
16.9
7.8
8.5
16.1
14.8
3.2
3.0
20.6
20.9
1.4
1.3
Inox Wind
Neutral
185
-
4,115
5,605
6,267
15.7
16.4
24.8
30.0
7.5
6.2
2.1
1.5
25.9
24.4
0.8
0.6
KEC International
Neutral
137
-
3,513
9,294
10,186
7.9
8.1
9.9
11.9
13.8
11.5
2.0
1.8
15.6
16.3
0.6
0.6
Thermax
Neutral
863
-
10,289
5,421
5,940
7.3
7.3
25.7
30.2
33.6
28.6
4.1
3.7
12.2
13.1
1.8
1.6
VATech Wabag
Buy
488
681
2,662
3,136
3,845
8.9
9.1
26.0
35.9
18.8
13.6
2.4
2.0
13.4
15.9
0.8
0.6
Cement
ACC
Neutral
1,334
-
25,048
11,225
13,172
13.2
16.9
44.5
75.5
30.0
17.7
2.8
2.6
11.2
14.2
2.3
1.9
Ambuja Cements
Neutral
202
-
40,189
9,350
10,979
18.2
22.5
5.8
9.5
34.9
21.3
2.9
2.6
10.2
12.5
4.5
3.8
India Cements
Neutral
116
-
3,557
4,364
4,997
18.5
19.2
7.9
11.3
14.7
10.3
1.1
1.0
8.0
8.5
1.6
1.4
JK Cement
Neutral
774
-
5,412
4,398
5,173
15.5
17.5
31.2
55.5
24.8
13.9
3.0
2.6
12.0
15.5
1.8
1.5
J K Lakshmi Cement
Buy
380
565
4,467
2,913
3,412
14.5
19.5
7.5
22.5
50.6
16.9
3.1
2.6
12.5
18.0
2.1
1.8
Orient Cement
Buy
135
215
2,772
2,114
2,558
18.5
20.5
8.1
11.3
16.7
12.0
2.5
2.1
9.0
14.0
2.0
1.5
UltraTech Cement
Neutral
3,370
-
92,487
25,768
30,385
21.0
23.5
111.0
160.0
30.4
21.1
3.9
3.4
13.5
15.8
3.7
3.1
Construction
ITNL
Neutral
89
-
2,913
8,946
10,017
31.0
31.6
8.1
9.1
10.9
9.7
0.4
0.4
4.2
5.0
3.7
3.4
KNR Constructions
Buy
736
802
2,071
1,385
1,673
14.7
14.0
41.2
48.5
17.9
15.2
3.3
2.9
14.9
15.2
1.5
1.2
Larsen & Toubro
Buy
1,372
1,700
127,881
67,665
77,249
10.7
11.5
57.3
71.2
24.0
19.3
2.2
2.1
12.6
14.3
2.1
1.8
Gujarat Pipavav Port
Neutral
139
-
6,734
705
788
52.2
51.7
5.0
5.6
27.9
24.9
2.8
2.5
11.2
11.2
9.7
8.2
Nagarjuna Const.
Neutral
75
-
4,195
8,842
9,775
9.1
8.8
5.3
6.4
14.2
11.8
1.1
1.0
8.2
9.1
0.6
0.5
PNC Infratech
Buy
114
143
2,932
2,350
2,904
13.1
13.2
9.0
8.8
12.7
13.0
0.5
0.4
15.9
13.9
1.3
1.1
Simplex Infra
Neutral
316
-
1,561
6,829
7,954
10.5
10.5
31.4
37.4
10.1
8.4
1.0
1.0
9.9
13.4
0.6
0.5
Power Mech Projects
Neutral
438
-
644
1,801
2,219
12.7
14.6
72.1
113.9
6.1
3.9
1.1
0.9
16.8
11.9
0.4
0.3
Sadbhav Engineering
Accumulate
280
298
4,798
3,598
4,140
10.3
10.6
9.0
11.9
31.1
23.5
3.3
2.9
9.9
11.9
1.6
1.4
NBCC
Neutral
220
-
13,203
7,428
9,549
7.9
8.6
8.2
11.0
26.8
20.0
1.3
1.1
28.2
28.7
1.5
1.1
MEP Infra
Neutral
35
-
571
1,877
1,943
30.6
29.8
3.0
4.2
11.7
8.4
5.7
3.8
0.6
0.6
1.7
1.5
SIPL
Neutral
92
-
3,244
1,036
1,252
65.5
66.2
(8.4)
(5.6)
3.5
3.9
(22.8)
(15.9)
11.3
9.4
Stock Watch
November 17, 2016
Company Name
Reco
CMP
Target
Mkt Cap
Sales ( Čcr )
OPM(%)
EPS (Č)
PER(x)
P/BV(x)
RoE(%)
EV/Sales(x)
(Č)
Price ( Č)
( Č cr )
FY17E
FY18E
FY17E
FY18E
FY17E
FY18E
FY17E
FY18E
FY17E
FY18E
FY17E
FY18E
FY17E
FY18E
Construction
Engineers India
Neutral
260
-
8,755
1,725
1,935
16.0
19.1
11.4
13.9
22.8
18.7
3.1
3.0
13.4
15.3
4.0
3.5
Financials
Axis Bank
Buy
472
630
112,667
46,932
53,575
3.5
3.4
32.4
44.6
14.6
10.6
1.9
1.6
13.6
16.5
-
-
Bank of Baroda
Neutral
173
-
39,920
19,980
23,178
1.8
1.8
11.5
17.3
15.1
10.0
1.7
1.4
8.3
10.1
-
-
Canara Bank
Neutral
320
-
17,362
15,225
16,836
1.8
1.8
14.5
28.0
22.1
11.4
1.5
1.2
5.8
8.5
-
-
Dewan Housing Finance Buy
231
350
7,225
2,225
2,688
2.9
2.9
29.7
34.6
7.8
6.7
1.3
1.1
16.1
16.8
-
-
Equitas Holdings
Buy
158
235
5,286
939
1,281
11.7
11.5
5.8
8.2
27.2
19.2
2.3
2.1
10.9
11.5
-
-
Federal Bank
Neutral
72
-
12,431
9,353
10,623
2.9
2.9
4.4
5.8
16.4
12.5
1.6
1.4
9.5
11.0
-
-
HDFC
Neutral
1,255
-
198,348
11,475
13,450
3.4
3.4
45.3
52.5
27.7
23.9
5.3
4.7
20.2
20.5
-
-
HDFC Bank
Accumulate
1,244
1,350
314,923
46,097
55,433
4.5
4.5
58.4
68.0
21.3
18.3
3.7
3.1
18.8
18.6
-
-
ICICI Bank
Buy
266
315
154,935
42,800
44,686
3.1
3.3
18.0
21.9
14.8
12.2
2.0
1.9
11.1
12.3
-
-
LIC Housing Finance
Buy
512
630
25,856
3,712
4,293
2.6
2.5
39.0
46.0
13.1
11.1
2.5
2.1
19.9
20.1
-
-
Punjab Natl.Bank
Neutral
149
-
31,664
23,532
23,595
2.3
2.4
6.8
12.6
21.9
11.8
3.4
2.4
3.3
6.5
-
-
RBL Bank
Neutral
354
-
13,093
1,783
2,309
2.6
2.6
12.7
16.4
27.9
21.6
3.0
2.7
12.8
13.3
-
-
South Ind.Bank
Neutral
22
-
3,011
6,435
7,578
2.5
2.5
2.7
3.1
8.3
7.2
1.1
0.9
10.1
11.2
-
-
St Bk of India
Neutral
277
-
215,145
88,650
98,335
2.6
2.6
13.5
18.8
20.5
14.7
2.0
1.7
7.0
8.5
-
-
Union Bank
Neutral
147
-
10,126
13,450
14,925
2.3
2.3
25.5
34.5
5.8
4.3
0.8
0.7
7.5
10.2
-
-
Yes Bank
Neutral
1,179
-
49,653
8,978
11,281
3.3
3.4
74.0
90.0
15.9
13.1
3.0
2.6
17.0
17.2
-
-
FMCG
Asian Paints
Neutral
934
-
89,623
17,128
18,978
16.8
16.4
19.1
20.7
48.9
45.1
17.0
16.1
34.8
35.5
4.9
4.4
Britannia
Buy
2,990
3,626
35,878
9,594
11,011
14.6
14.9
80.3
94.0
37.2
31.8
15.3
11.8
41.2
-
3.5
3.0
Colgate
Accumulate
926
995
25,198
4,605
5,149
23.4
23.4
23.8
26.9
38.9
34.4
21.6
16.8
64.8
66.8
5.3
4.7
Dabur India
Accumulate
275
304
48,420
8,315
9,405
19.8
20.7
8.1
9.2
34.0
29.9
9.5
7.8
31.6
31.0
5.4
4.7
GlaxoSmith Con*
Neutral
4,921
-
20,696
4,350
4,823
21.2
21.4
179.2
196.5
27.5
25.1
7.3
6.2
27.1
26.8
4.2
3.7
Godrej Consumer
Neutral
1,415
-
48,196
10,235
11,428
18.4
18.6
41.1
44.2
34.4
32.0
7.6
6.4
24.9
24.8
4.6
4.0
HUL
Neutral
807
-
174,557
35,252
38,495
17.8
17.8
20.7
22.4
39.1
36.0
37.3
32.0
95.6
88.9
4.8
4.4
ITC
Buy
231
284
278,474
40,059
44,439
38.3
39.2
9.0
10.1
25.7
22.8
7.2
6.3
27.8
27.5
6.7
6.0
Marico
Buy
248
300
31,932
6,430
7,349
18.8
19.5
6.4
7.7
38.7
32.1
11.7
9.8
33.2
32.5
4.6
4.0
Nestle*
Neutral
5,978
-
57,633
10,073
11,807
20.7
21.5
124.8
154.2
47.9
38.8
19.7
17.7
34.8
36.7
5.5
4.7
Tata Global
Neutral
121
-
7,656
8,675
9,088
9.8
9.8
7.4
8.2
16.4
14.8
1.9
1.8
7.9
8.1
0.8
0.7
Procter & Gamble
Accumulate
6,618
7,369
21,482
2,939
3,342
23.2
23.0
146.2
163.7
45.3
40.4
101.4
97.2
25.3
23.5
7.0
6.1
Hygiene
Stock Watch
November 17, 2016
Company Name
Reco
CMP
Target
Mkt Cap
Sales ( Čcr )
OPM(%)
EPS (Č)
PER(x)
P/BV(x)
RoE(%)
EV/Sales(x)
(Č)
Price ( Č)
( Č cr )
FY17E FY18E
FY17E
FY18E
FY17E
FY18E
FY17E
FY18E
FY17E
FY18E
FY17E
FY18E
FY17E
FY18E
IT
HCL Tech^
Buy
776
1,000
109,517
49,242
57,168
20.5
20.5
55.7
64.1
13.9
12.1
2.8
2.2
20.3
17.9
2.1
1.7
Infosys
Buy
940
1,249
215,936
68,350
77,326
27.0
27.0
62.5
69.4
15.0
13.6
3.2
2.9
21.3
21.6
2.6
2.2
TCS
Buy
2,190
2,620
431,573
119,025
133,308
27.6
27.6
131.2
145.5
16.7
15.1
5.4
5.0
32.4
33.1
3.3
2.9
Tech Mahindra
Buy
443
600
43,031
29,673
32,937
15.5
17.0
32.8
39.9
13.5
11.1
2.7
2.3
19.6
20.7
1.2
1.0
Wipro
Buy
444
590
107,949
55,440
60,430
18.1
18.1
35.9
39.9
12.4
11.1
2.2
2.0
19.0
19.3
1.7
1.5
Media
D B Corp
Neutral
368
-
6,764
2,297
2,590
27.4
28.2
21.0
23.4
17.5
15.7
4.1
3.5
23.7
23.1
2.8
2.4
HT Media
Neutral
75
-
1,744
2,693
2,991
12.6
12.9
7.9
9.0
9.5
8.3
0.8
0.7
7.8
8.3
0.2
0.1
Jagran Prakashan
Buy
175
225
5,714
2,355
2,635
28.0
28.0
10.8
12.5
16.2
14.0
3.5
3.0
21.7
21.7
2.5
2.2
Sun TV Network
Neutral
491
-
19,344
2,850
3,265
70.1
71.0
26.2
30.4
18.7
16.2
4.8
4.2
24.3
25.6
6.4
5.4
Hindustan Media
Neutral
276
-
2,024
1,016
1,138
24.3
25.2
27.3
30.1
10.1
9.2
1.9
1.7
16.2
15.8
1.3
1.1
Ventures
TV Today Network
Buy
312
385
1,860
637
743
27.5
27.5
18.4
21.4
17.0
14.6
3.0
2.5
17.4
17.2
2.4
2.0
Metals & Mining
Coal India
Neutral
313
-
197,450
84,638
94,297
21.4
22.3
24.5
27.1
12.8
11.5
5.3
5.1
42.6
46.0
1.9
1.7
Hind. Zinc
Neutral
238
-
100,415
14,252
18,465
55.9
48.3
15.8
21.5
15.0
11.1
2.5
2.1
17.0
20.7
7.1
5.5
Hindalco
Neutral
163
-
33,670
107,899
112,095
7.4
8.2
9.2
13.0
17.7
12.5
0.9
0.8
4.8
6.6
0.8
0.8
JSW Steel
Neutral
1,698
-
41,055
53,201
58,779
16.1
16.2
130.6
153.7
13.0
11.1
1.8
1.5
14.0
14.4
1.5
1.3
NMDC
Neutral
115
-
36,337
6,643
7,284
44.4
47.7
7.1
7.7
16.2
14.9
1.4
1.4
8.8
9.2
3.4
3.0
SAIL
Neutral
50
-
20,754
47,528
53,738
(0.7)
2.1
(1.9)
2.6
19.3
0.6
0.5
(1.6)
3.9
1.3
1.2
Vedanta
Neutral
207
-
61,280
71,744
81,944
19.2
21.7
13.4
20.1
15.4
10.3
1.3
1.2
8.4
11.3
1.3
1.0
Tata Steel
Neutral
392
-
38,047
121,374
121,856
7.2
8.4
18.6
34.3
21.1
11.4
1.3
1.2
6.1
10.1
1.0
0.9
Oil & Gas
Cairn India
Neutral
231
-
43,356
9,127
10,632
4.3
20.6
8.8
11.7
26.3
19.8
0.8
0.8
3.3
4.2
6.3
5.2
GAIL
Neutral
429
-
54,354
56,220
65,198
9.3
10.1
27.1
33.3
15.8
12.9
1.5
1.4
9.3
10.7
1.2
1.0
ONGC
Neutral
272
-
233,009
137,222
152,563
15.0
21.8
19.5
24.1
14.0
11.3
1.2
1.1
8.5
10.1
2.0
1.8
Indian Oil Corp
Neutral
289
-
140,093
373,359
428,656
5.9
5.5
54.0
59.3
5.3
4.9
0.8
0.7
16.0
15.6
0.5
0.4
Reliance Industries
Neutral
986
-
319,656
301,963
358,039
12.1
12.6
87.7
101.7
11.2
9.7
1.2
1.1
10.7
11.3
1.5
1.3
Pharmaceuticals
Alembic Pharma
Neutral
609
-
11,486
3,483
4,083
20.2
21.4
24.3
30.4
25.1
20.0
5.7
4.6
25.5
25.3
3.4
2.8
Aurobindo Pharma
Buy
715
877
41,813
15,720
18,078
23.7
23.7
41.4
47.3
17.3
15.1
4.5
3.5
29.6
26.1
3.0
2.6
Aventis*
Neutral
4,163
-
9,588
2,277
2,597
17.3
18.3
149.4
172.0
27.9
24.2
4.6
3.7
25.1
28.8
4.0
3.2
Cadila Healthcare
Accumulate
374
400
38,334
10,429
12,318
22.6
22.0
16.9
19.2
22.2
19.5
5.6
4.5
28.5
25.7
3.5
2.9
Cipla
Neutral
539
-
43,284
15,378
18,089
17.4
18.4
21.6
27.2
24.9
19.8
3.2
2.8
13.7
15.2
3.1
2.6
Stock Watch
November 17, 2016
Company Name
Reco
CMP
Target
Mkt Cap
Sales ( Čcr )
OPM(%)
EPS (Č)
PER(x)
P/BV(x)
RoE(%)
EV/Sales(x)
(Č)
Price ( Č)
( Č cr )
FY17E FY18E
FY17E
FY18E
FY17E
FY18E
FY17E
FY18E
FY17E
FY18E
FY17E
FY18E
FY17E
FY18E
Pharmaceuticals
Dr Reddy's
Neutral
3,213
-
53,238
16,043
18,119
20.8
22.4
112.4
142.9
28.6
22.5
3.8
3.3
14.1
15.9
3.4
3.0
Dishman Pharma
Neutral
228
-
3,680
1,718
1,890
22.7
22.8
9.5
11.3
24.0
20.2
2.3
2.1
10.1
10.9
2.6
2.3
GSK Pharma*
Neutral
2,654
-
22,482
3,000
3,312
15.4
20.6
46.5
60.8
57.1
43.7
13.7
13.7
26.3
30.6
7.2
6.6
Indoco Remedies
Sell
296
240
2,729
1,112
1,289
16.2
18.2
11.6
16.0
25.5
18.5
4.1
3.4
17.0
20.1
2.5
2.1
Ipca labs
Accumulate
528
613
6,667
3,303
3,799
15.3
15.3
17.3
19.7
30.5
26.8
2.7
2.4
9.1
9.4
2.2
1.9
Lupin
Buy
1,408
1,809
63,458
15,912
18,644
26.4
26.7
58.1
69.3
24.2
20.3
4.7
3.9
21.4
20.9
4.2
3.4
Sun Pharma
Buy
668
944
160,755
31,129
35,258
30.0
30.9
28.0
32.8
23.9
20.4
3.7
3.0
18.7
18.9
4.9
4.1
Power
Tata Power
Neutral
71
-
19,122
36,916
39,557
17.4
27.1
5.1
6.3
13.9
11.2
1.2
1.1
9.0
10.3
1.5
1.4
NTPC
Neutral
150
-
123,682
86,605
95,545
17.5
20.8
11.8
13.4
12.7
11.2
1.3
1.2
10.5
11.1
2.8
2.8
Power Grid
Neutral
188
-
98,328
25,763
29,762
74.3
73.1
14.8
17.3
12.7
10.9
2.0
1.7
16.9
17.5
8.0
7.6
Real Estate
Prestige Estate
Buy
164
210
6,133
4,707
5,105
25.2
26.0
10.3
13.0
15.9
12.6
1.3
1.2
10.3
10.2
2.4
2.1
MLIFE
Buy
373
522
1,530
1,152
1,300
22.7
24.6
29.9
35.8
12.5
10.4
0.9
0.9
7.6
8.6
2.0
1.7
Telecom
Bharti Airtel
Neutral
310
-
123,740
105,086
114,808
34.5
34.7
12.2
16.4
25.4
18.9
1.7
1.6
6.8
8.4
2.1
1.8
Idea Cellular
Neutral
71
-
25,386
40,133
43,731
37.2
37.1
6.4
6.5
11.0
10.9
0.9
0.9
8.2
7.6
1.7
1.4
zOthers
Abbott India
Neutral
4,569
-
9,710
3,153
3,583
14.1
14.4
152.2
182.7
30.0
25.0
147.4
125.9
25.6
26.1
2.8
2.4
Asian Granito
Buy
209
351
628
1,071
1,182
12.1
12.4
12.7
16.0
16.4
13.1
1.6
1.4
9.5
10.7
0.9
0.7
Bajaj Electricals
Buy
220
306
2,227
5,099
5,805
5.6
5.9
11.4
14.6
19.4
15.1
2.6
2.3
13.4
15.1
0.4
0.4
Banco Products (India)
Neutral
177
-
1,264
1,353
1,471
12.3
12.4
14.5
16.3
12.2
10.8
16.8
15.2
14.5
14.6
0.9
94.9
Coffee Day Enterprises
Neutral
211
-
4,352
2,964
3,260
20.5
21.2
4.7
8.0
-
26.4
2.4
2.2
5.5
8.5
1.9
1.7
Ltd
Competent Automobiles Neutral
165
-
101
1,137
1,256
3.1
2.7
28.0
23.6
5.9
7.0
31.7
28.7
14.3
11.5
0.1
0.1
Elecon Engineering
Neutral
48
-
525
1,482
1,660
13.7
14.5
3.9
5.8
12.4
8.3
2.9
2.7
7.8
10.9
0.7
0.6
Finolex Cables
Neutral
399
-
6,109
2,883
3,115
12.0
12.1
14.2
18.6
28.1
21.5
15.0
13.1
15.8
14.6
1.7
1.5
Garware Wall Ropes
Accumulate
597
600
1,307
873
938
14.3
14.3
35.2
37.5
17.0
15.9
3.0
2.5
17.5
15.9
1.3
1.2
Goodyear India*
Neutral
719
-
1,659
1,598
1,704
10.4
10.2
49.4
52.6
14.6
13.7
67.2
59.0
18.2
17.0
0.8
105.6
Hitachi
Neutral
1,206
-
3,280
2,081
2,433
8.8
8.9
33.4
39.9
36.1
30.2
29.1
24.3
22.1
21.4
1.6
1.3
HSIL
Neutral
284
-
2,054
2,384
2,515
15.8
16.3
15.3
19.4
18.6
14.6
18.5
15.9
7.8
9.3
1.0
0.9
Interglobe Aviation
Neutral
833
-
30,032
21,122
26,005
14.5
27.6
110.7
132.1
7.5
6.3
45.1
32.2
168.5
201.1
1.5
1.2
Jyothy Laboratories
Neutral
347
-
6,302
1,440
2,052
11.5
13.0
8.5
10.0
40.8
34.7
9.9
9.2
18.6
19.3
4.3
3.0
Kirloskar Engines India
Neutral
334
-
4,824
2,554
2,800
9.9
10.0
10.5
12.1
31.8
27.6
13.3
12.5
10.7
11.7
1.6
1.4
Ltd
Stock Watch
November 17, 2016
Company Name
Reco
CMP
Target
Mkt Cap
Sales ( Čcr )
OPM(%)
EPS (Č)
PER(x)
P/BV(x)
RoE(%)
EV/Sales(x)
(Č)
Price ( Č)
( Č cr )
FY17E
FY18E
FY17E
FY18E
FY17E
FY18E
FY17E
FY18E
FY17E
FY18E
FY17E
FY18E
FY17E
FY18E
zOthers
Linc Pen & Plastics
Neutral
246
-
363
382
420
9.3
9.5
13.5
15.7
18.2
15.6
3.1
2.7
17.1
17.3
1.0
0.9
M M Forgings
Neutral
425
-
513
546
608
20.4
20.7
41.3
48.7
10.3
8.7
58.2
51.5
16.6
17.0
0.8
0.7
Manpasand Bever.
Neutral
663
-
3,792
836
1,087
19.6
19.4
16.9
23.8
39.2
27.8
4.7
4.1
12.0
14.8
4.3
3.2
Mirza International
Buy
78
107
937
987
1,106
18.0
18.0
6.5
7.6
11.9
10.2
1.9
1.6
15.9
15.7
1.2
1.0
MT Educare
Neutral
117
-
467
366
417
17.7
18.2
9.4
10.8
12.5
10.9
2.8
2.4
22.2
22.3
1.2
1.0
Narayana Hrudaya
Neutral
333
-
6,805
1,873
2,166
11.5
11.7
2.6
4.0
125.9
84.0
7.7
7.0
6.1
8.3
3.7
3.2
Navkar Corporation
Buy
182
265
2,597
408
612
42.9
42.3
6.8
11.5
26.9
15.8
1.9
1.7
6.9
10.5
7.3
4.9
Navneet Education
Neutral
107
-
2,555
1,062
1,147
24.0
24.0
6.1
6.6
17.6
16.2
3.6
3.2
20.6
19.8
2.5
2.3
Nilkamal
Neutral
1,294
-
1,932
1,995
2,165
10.7
10.4
69.8
80.6
18.5
16.1
74.0
64.3
16.6
16.5
1.0
0.9
Page Industries
Neutral
12,974
-
14,471
2,450
3,124
20.1
17.6
299.0
310.0
43.4
41.9
288.9
220.6
47.1
87.5
6.0
4.8
Parag Milk Foods
Neutral
267
-
2,249
1,919
2,231
9.3
9.6
9.5
12.9
28.3
20.7
4.4
3.6
15.5
17.5
1.4
1.2
Quick Heal
Neutral
234
-
1,640
408
495
27.3
27.0
7.7
8.8
30.2
26.6
2.8
2.8
9.3
10.6
3.2
2.7
Radico Khaitan
Buy
118
147
1,574
1,667
1,824
13.0
13.2
6.7
8.2
17.8
14.5
1.6
1.5
9.0
10.2
1.4
1.2
Relaxo Footwears
Neutral
398
-
4,776
2,085
2,469
9.2
8.2
7.6
8.0
52.6
50.1
20.4
17.4
17.9
18.8
2.4
2.0
S H Kelkar & Co.
Neutral
295
-
4,263
1,036
1,160
15.1
15.0
6.1
7.2
48.3
41.1
5.2
4.7
10.7
11.5
3.8
3.3
Siyaram Silk Mills
Accumulate
1,230
1,714
1,153
1,799
2,040
11.6
11.7
104.9
122.4
11.7
10.1
1.9
1.7
16.4
16.4
0.8
0.7
Styrolution ABS India*
Neutral
577
-
1,014
1,440
1,537
9.2
9.0
40.6
42.6
14.2
13.5
36.3
33.0
12.3
11.6
0.7
0.6
Surya Roshni
Neutral
198
-
867
3,342
3,625
7.8
7.5
17.3
19.8
11.5
10.0
21.8
17.5
10.5
10.8
0.5
0.5
Team Lease Serv.
Neutral
899
-
1,537
3,229
4,001
1.5
1.8
22.8
32.8
39.5
27.4
4.2
3.7
10.7
13.4
0.4
0.3
The Byke Hospitality
Neutral
176
-
706
287
384
20.5
20.5
7.6
10.7
23.2
16.5
4.8
3.9
20.7
23.5
2.5
1.8
Transport Corporation of
Neutral
177
-
1,356
2,671
2,911
8.5
8.8
13.9
15.7
12.8
11.3
1.8
1.6
13.7
13.8
0.6
0.6
India
TVS Srichakra
Neutral
3,398
-
2,602
2,304
2,614
13.7
13.8
231.1
266.6
14.7
12.7
381.8
300.6
33.9
29.3
1.1
0.9
UFO Moviez
Neutral
439
-
1,211
619
685
33.2
33.4
30.0
34.9
14.6
12.6
2.0
1.8
13.8
13.9
1.7
1.4
Visaka Industries
Neutral
193
-
306
1,051
1,138
10.3
10.4
21.0
23.1
9.2
8.3
24.7
23.1
9.0
9.2
0.6
0.5
VRL Logistics
Neutral
265
-
2,415
1,902
2,119
16.7
16.6
14.6
16.8
18.2
15.7
4.0
3.5
21.9
22.2
1.4
1.2
Wonderla Holidays
Neutral
340
-
1,922
287
355
38.0
40.0
11.3
14.2
30.1
24.0
4.3
3.8
21.4
23.9
6.6
5.3
Source: Company, Angel Research; Note: *December year end; #September year end; &October year end; Price as on November 16, 2016
Market Outlook
November 17, 2016
Research Team Tel: 022 - 39357800
DISCLAIMER
Angel Broking Private Limited (hereinafter referred to as “Angel”) is a registered Member of National Stock Exchange of India
Limited,Bombay Stock Exchange Limited and Metropolitan Stock Exchange Limited. It is also registered as a Depository Participant with
CDSL and Portfolio Manager with SEBI. It also has registration with AMFI as a Mutual Fund Distributor. Angel Broking Private Limited is a
registered entity with SEBI for Research Analyst in terms of SEBI (Research Analyst) Regulations, 2014 vide registration number
INH000000164. Angel or its associates has not been debarred/ suspended by SEBI or any other regulatory authority for accessing
/dealing in securities Market. Angel or its associates/analyst has not received any compensation / managed or
co-managed public offering of securities of the company covered by Analyst during the past twelve months.
This document is solely for the personal information of the recipient, and must not be singularly used as the basis of any investment
decision. Nothing in this document should be construed as investment or financial advice. Each recipient of this document should make
such investigations as they deem necessary to arrive at an independent evaluation of an investment in the securities of the companies
referred to in this document (including the merits and risks involved), and should consult their own advisors to determine the merits and
risks of such an investment.
Reports based on technical and derivative analysis center on studying charts of a stock's price movement, outstanding positions and
trading volume, as opposed to focusing on a company's fundamentals and, as such, may not match with a report on a company's
fundamentals. Investors are advised to refer the Fundamental and Technical Research Reports available on our website to evaluate the
contrary view, if any.
The information in this document has been printed on the basis of publicly available information, internal data and other reliable
sources believed to be true, but we do not represent that it is accurate or complete and it should not be relied on as such, as this
document is for general guidance only. Angel Broking Pvt. Limited or any of its affiliates/ group companies shall not be in any way
responsible for any loss or damage that may arise to any person from any inadvertent error in the information contained in this report.
Angel Broking Pvt. Limited has not independently verified all the information contained within this document. Accordingly, we cannot
testify, nor make any representation or warranty, express or implied, to the accuracy, contents or data contained within this document.
While Angel Broking Pvt. Limited endeavors to update on a reasonable basis the information discussed in this material, there may be
regulatory, compliance, or other reasons that prevent us from doing so.
This document is being supplied to you solely for your information, and its contents, information or data may not be reproduced,
redistributed or passed on, directly or indirectly.
Neither Angel Broking Pvt. Limited, nor its directors, employees or affiliates shall be liable for any loss or damage that may arise from
or in connection with the use of this information.